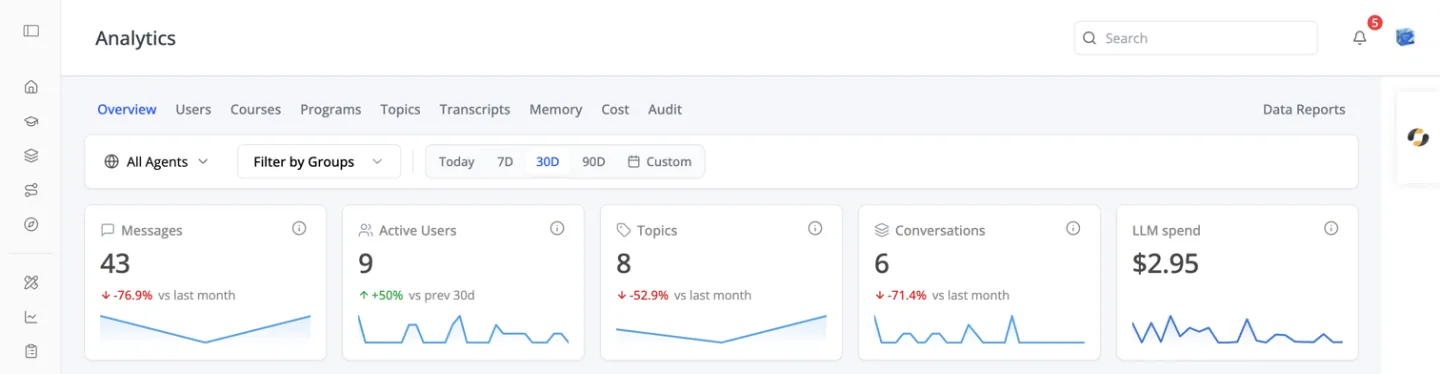
 The **Overview** opens with five KPIs — Messages, Active Users, Topics, Conversations and **LLM spend** — each with a sparkline and a change against the previous period, then a Sessions chart and the most-discussed topics ranked by messages.
| Tab | What it answers |
|---|---|
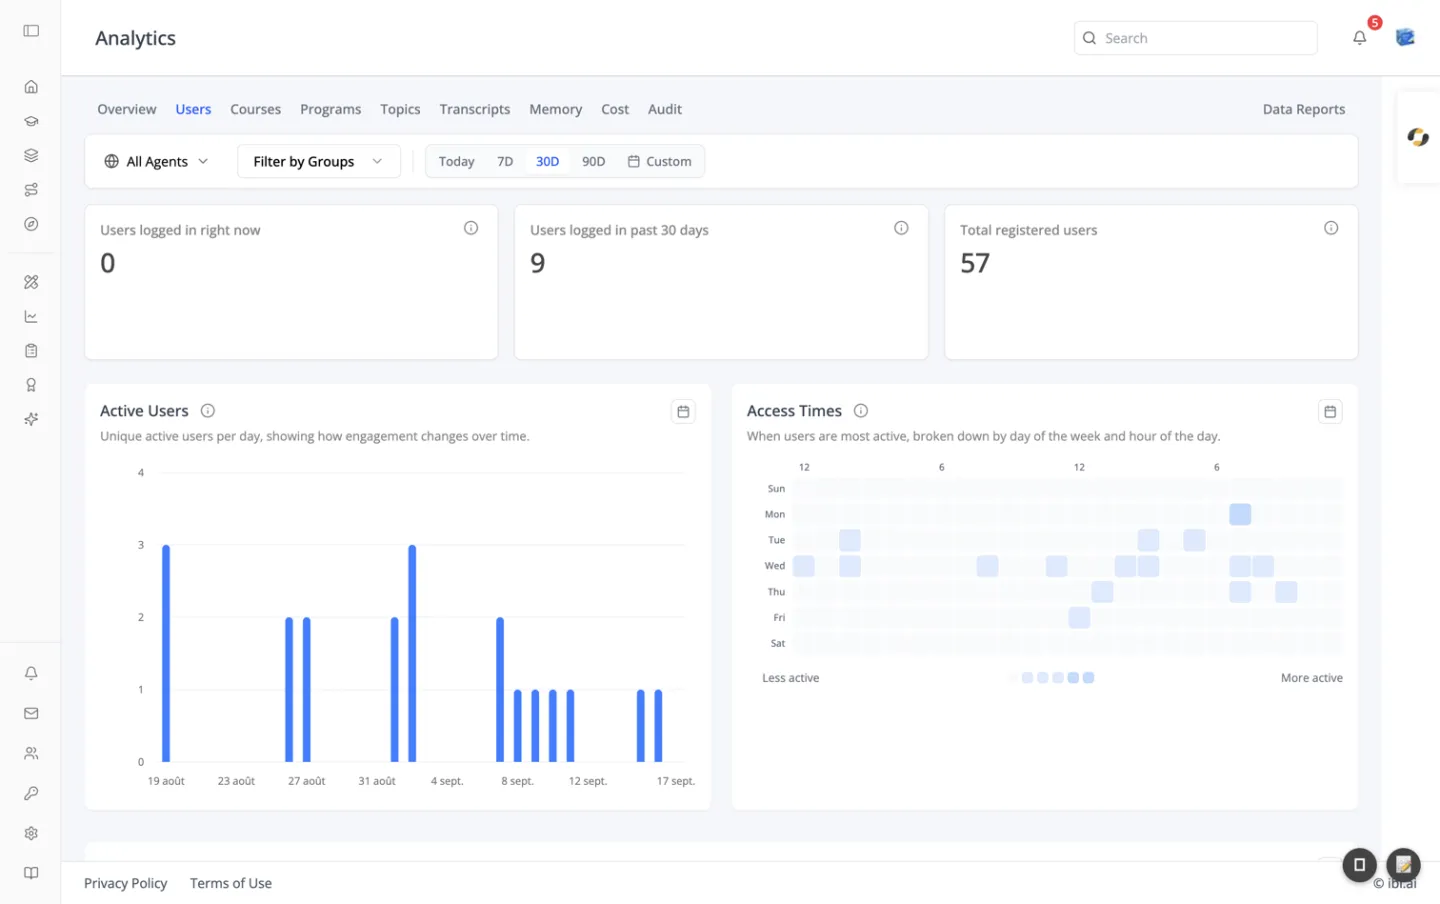
| Users | Who is logged in now, in the past 30 days, and in total — plus an access-times heatmap by day and hour |
| Topics | What people ask about, and how conversations trend over time |
| Transcripts | What was actually said, with documents, tool calls and per-turn details |
| Memory | What the agents remember, per user, per agent or globally |
| Cost | What it costs — by provider, model, user and call — and how fast each model answers |
| Audit | Who changed an agent's configuration, and organization-wide security events |
| Data Reports | Asynchronous CSV and JSON exports: generate, poll, download |
 ## How do you see AI spend by model in ibl.ai?
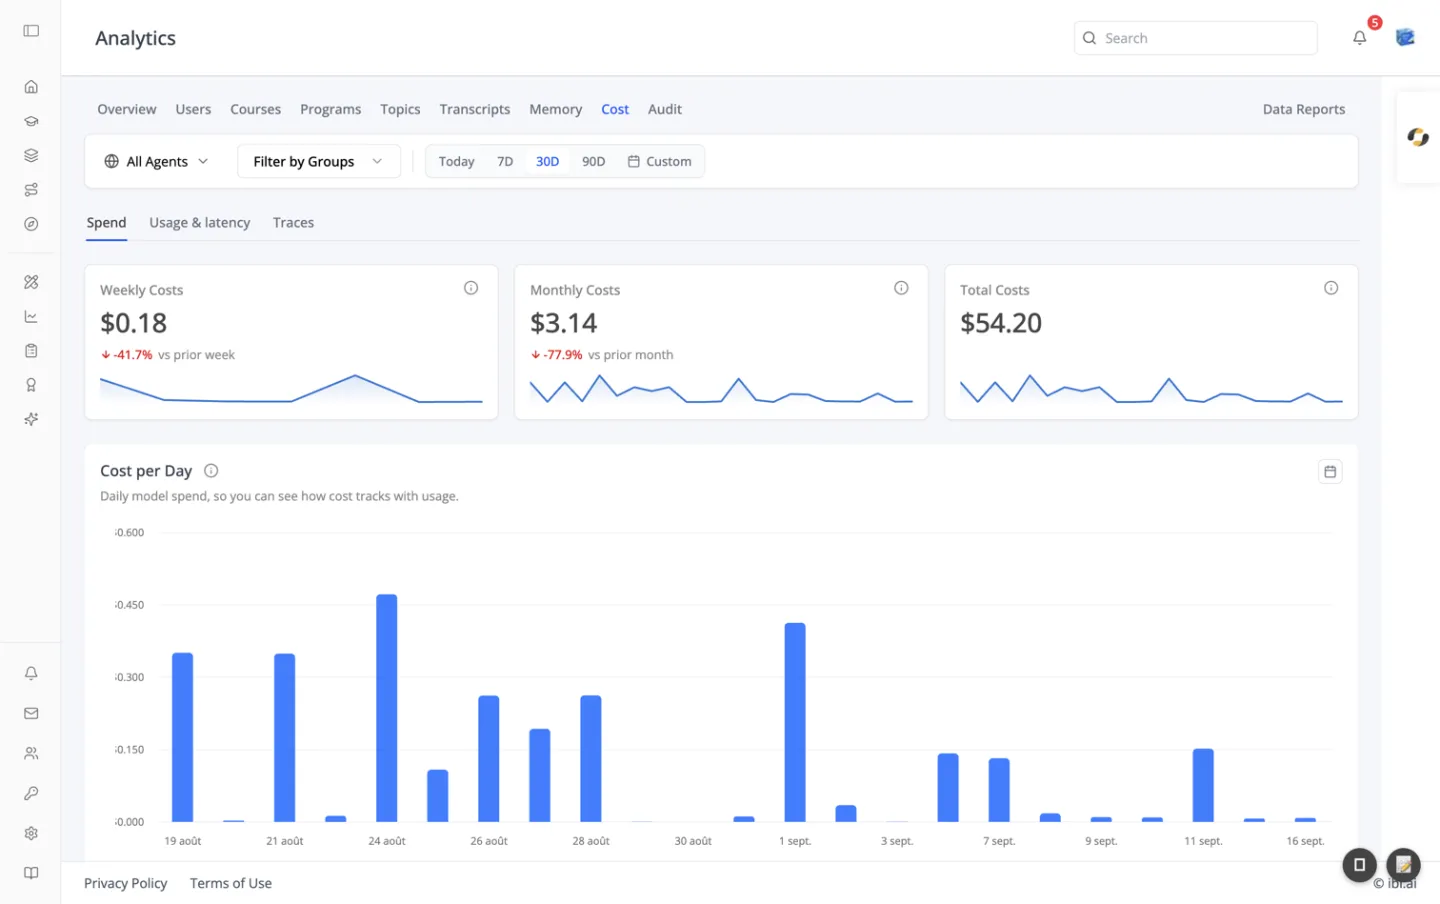
On the **Cost** tab, which has three views. **Spend** shows weekly, monthly and total costs, cost per day, cost by provider and model, and cost per user — each user linking through to their individual calls.
## How do you see AI spend by model in ibl.ai?
On the **Cost** tab, which has three views. **Spend** shows weekly, monthly and total costs, cost per day, cost by provider and model, and cost per user — each user linking through to their individual calls.
 **Usage & latency** shows LLM spend, tokens, LLM calls and p95 latency, then ranks every model by the spend attributed to it and shows its **p50 and p95 response time** beside it. It is the view that settles which model is worth what it costs for a given job.
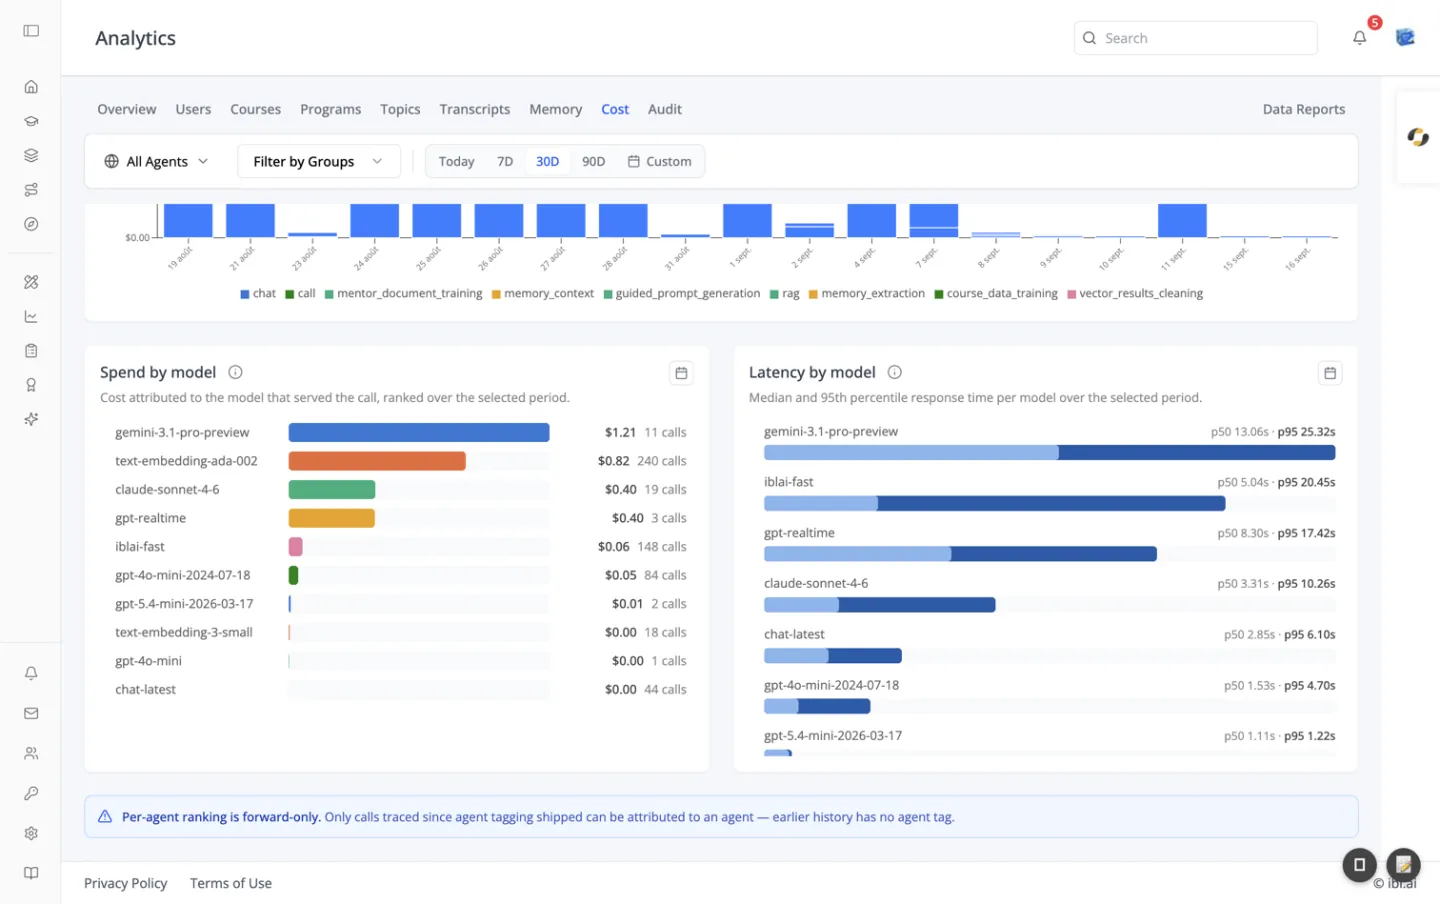 In the 30-day window shown, one preview model cost $1.21 across 11 calls at a p95 of 25 seconds, while an embedding model made 240 calls for $0.82 — the trade-off this view exists to show.
**Traces** lists every call — service, user, latency and cost — with a detail panel, and each trace links straight to the transcript it came from.
## What can you see inside an ibl.ai conversation transcript?
The Transcripts tab replays a conversation the way the chat rendered it, from the context the platform attaches to each turn. Each piece renders only when the turn carries it:
- **Attachments** — the files and images exchanged on a turn.
- **Retrieved documents** — the chunks an answer cited, with source, snippet and relevance score.
- **Tool calls** — each tool the agent used, with its input and output.
- **Show Details** — per turn, the model with its provider's logo, the temperature, the client, and the request context: session, flow, datasets, system prompt and file references.
Each conversation row carries badges counting the documents and tool calls it used, and names the person by full name, then email, then username. The same panel powers an agent's History tab, so an agent's owner and an organization's administrator read the same record.
## Who can see AI costs and audit logs in ibl.ai?
Access follows the platform's roles. Usage & latency and Traces need organization-admin analytics access; everyone else sees a permission notice rather than an error.
The platform-wide audit trail — logins and model changes, with IP address — shows only to organization admins or holders of the audit-log permission.
Costs are shown in US dollars exactly as the platform bills them, and the per-agent view never guesses at history it cannot attribute.
The documentation walks each tab in detail, starting at [Analytics overview](/docs/os/analytics/overview) and [Costs](/docs/os/analytics/costs).
## Want this level of visibility over your own AI spend?
We can show it running on your data in half an hour. [Book a 30-minute demo](https://cal.com/iblai/30min) or [talk to the ibl.ai team](/contact) — ibl.ai is family-owned and operated from New York, NY.
In the 30-day window shown, one preview model cost $1.21 across 11 calls at a p95 of 25 seconds, while an embedding model made 240 calls for $0.82 — the trade-off this view exists to show.
**Traces** lists every call — service, user, latency and cost — with a detail panel, and each trace links straight to the transcript it came from.
## What can you see inside an ibl.ai conversation transcript?
The Transcripts tab replays a conversation the way the chat rendered it, from the context the platform attaches to each turn. Each piece renders only when the turn carries it:
- **Attachments** — the files and images exchanged on a turn.
- **Retrieved documents** — the chunks an answer cited, with source, snippet and relevance score.
- **Tool calls** — each tool the agent used, with its input and output.
- **Show Details** — per turn, the model with its provider's logo, the temperature, the client, and the request context: session, flow, datasets, system prompt and file references.
Each conversation row carries badges counting the documents and tool calls it used, and names the person by full name, then email, then username. The same panel powers an agent's History tab, so an agent's owner and an organization's administrator read the same record.
## Who can see AI costs and audit logs in ibl.ai?
Access follows the platform's roles. Usage & latency and Traces need organization-admin analytics access; everyone else sees a permission notice rather than an error.
The platform-wide audit trail — logins and model changes, with IP address — shows only to organization admins or holders of the audit-log permission.
Costs are shown in US dollars exactly as the platform bills them, and the per-agent view never guesses at history it cannot attribute.
The documentation walks each tab in detail, starting at [Analytics overview](/docs/os/analytics/overview) and [Costs](/docs/os/analytics/costs).
## Want this level of visibility over your own AI spend?
We can show it running on your data in half an hour. [Book a 30-minute demo](https://cal.com/iblai/30min) or [talk to the ibl.ai team](/contact) — ibl.ai is family-owned and operated from New York, NY.