OS Platform Overview
What Is OS?
OS is ibl.ai's open-source AI agent platform. It lets organizations build, deploy, and manage intelligent conversational agents — from prototype to production — with full control over models, data, and branding.
The platform runs in production at os.ibl.ai and the source code is available at github.com/iblai/os. It ships as a web application, as desktop apps for macOS, Windows, and Linux, and as mobile apps for iOS and Android.
This documentation section covers every screen of the application: the chat and Canvas workspace, per-agent settings, analytics dashboards, organization administration, user profiles, and notifications.
Core Capabilities
AI Agents
Create custom agents with configurable LLMs, system prompts, tools, and safety filters. Every agent has its own settings, datasets, and access rules — see Agent Settings: Basic Information.
RAG Training
Ground agents in your own data: upload documents, connect Google Drive, OneDrive, or Dropbox, or crawl websites. Managed per agent under Datasets and per organization under Data Source Integrations.
Voice Calls
Real-time voice conversations with agents over WebRTC, powered by LiveKit. Configured in Voice settings and Voice Calls.
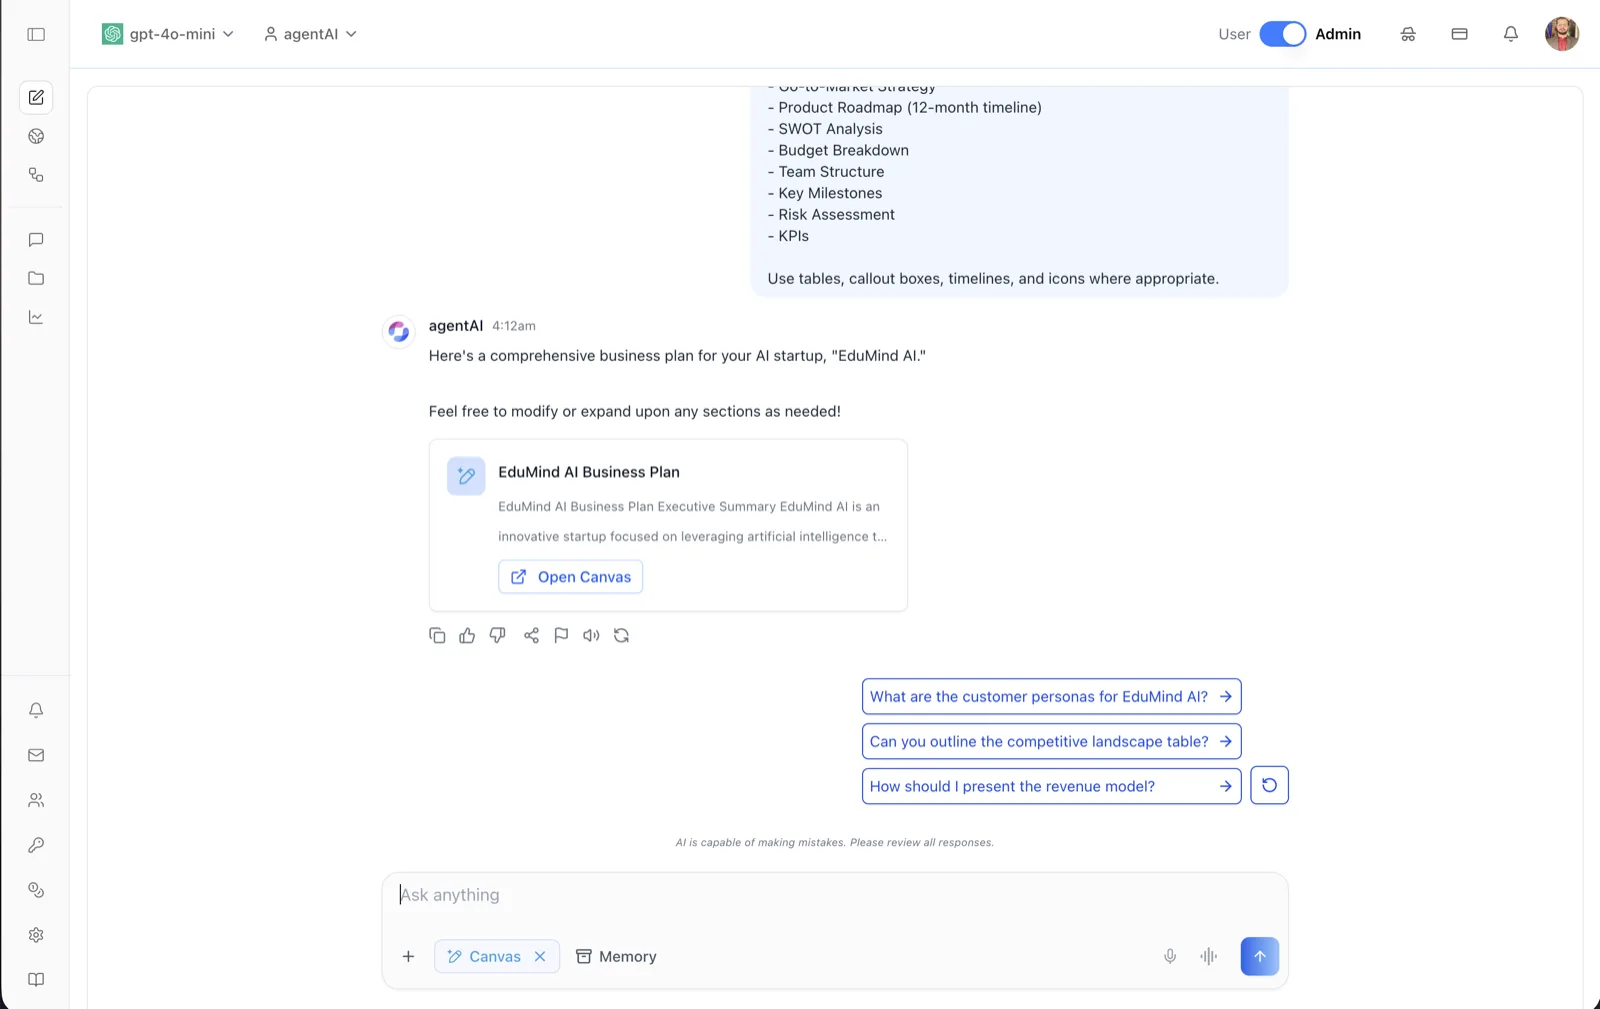
Canvas / Artifacts
Generate, edit, version, and export rich documents alongside chat. See Canvas, Canvas Options, and Downloading a Canvas.
Deep Research & Web Search
Extended multi-step reasoning for complex queries, plus live web results to ground responses. Available from the chat interface.
MCP Servers
Extend agent capabilities with Model Context Protocol tool servers, configured per agent in MCP Servers.
Analytics
Usage dashboards, per-user activity, topic analysis, a transcript viewer, cost tracking, and exportable data reports. See the Analytics section.
Evaluations
Measure and improve agent quality: run an agent against a benchmark of test questions, then score every response with LLM-as-Judge reviews and human annotations, and export the results. See Evals.
Multi-Organization, SSO & RBAC
Full organization isolation with per-organization configuration and branding, Single Sign-On, and granular role-based access control with roles, policies, groups, and teams. See Organization Settings.
Billing & Monetization
Stripe-backed subscription management and usage-based pricing at the organization level — see Billing and Monetization.
Embedding & API Access
Embed agents in any website via iframe with custom styling, and integrate programmatically with API keys and LTI 1.3 for LMS platforms. See Embed, API Access, and the LTI pages.
Human Support
Let people chatting with an agent hand the conversation to a human. Escalations arrive as tickets a support team can filter, reply to, and resolve — in the app or over the API. See Support.
Documentation Map
Chat & Canvas
The end-user workspace: Chat Interface · Canvas · Canvas Options · Downloading a Canvas · Renaming a Canvas
Agent Settings
Everything configurable on a single agent: Basic · System Prompt · LLM Selection · LLM Configuration · Capabilities · Tools · Skills · MCP Servers · Datasets · Memory · Voice · Voice Selector · Voice Calls · Safety · Privacy · Disclaimers · Discovery · Access Control · Embed · API Access · Agent Analytics · Evals · Audit Log · Chat History · Support · Tasks · Sandbox · LTI Keys · LTI Links · LTI Tool Endpoints · LTI Tools
Analytics
Organization-wide insight: Overview Dashboard · Users · Topics · Transcripts · Costs · Data Reports · Audit
Organization Settings
Organization administration: Organization · Users · Groups · Teams · Roles · Policies · Alerts · LLM Integrations · API Integrations · Data Source Integrations · Billing · Monetization · Advanced
Profile
Per-user account pages: Basic Information · Education · Education Credentials · Experience · Resume · Social Links · Memory · Privacy · Security · Purchases
Notifications
Staying informed: Inbox · Alerts
Common Components
Shared building blocks that appear across all ibl.ai applications — the profile dialog, notification center, analytics dashboards, and organization settings: Common Components
Related Resources
Source Code
The full application is open source at github.com/iblai/os under the MIT license.
API Skills & MCP Server
github.com/iblai/api packages 33 agent skills and a chat MCP server for operating any ibl.ai organization from an AI agent.
Vibe
github.com/iblai/vibe is the companion toolkit for building and shipping ibl.ai applications, including the build skills used to produce the desktop and mobile releases of OS.