Agent Settings: Analytics
Overview
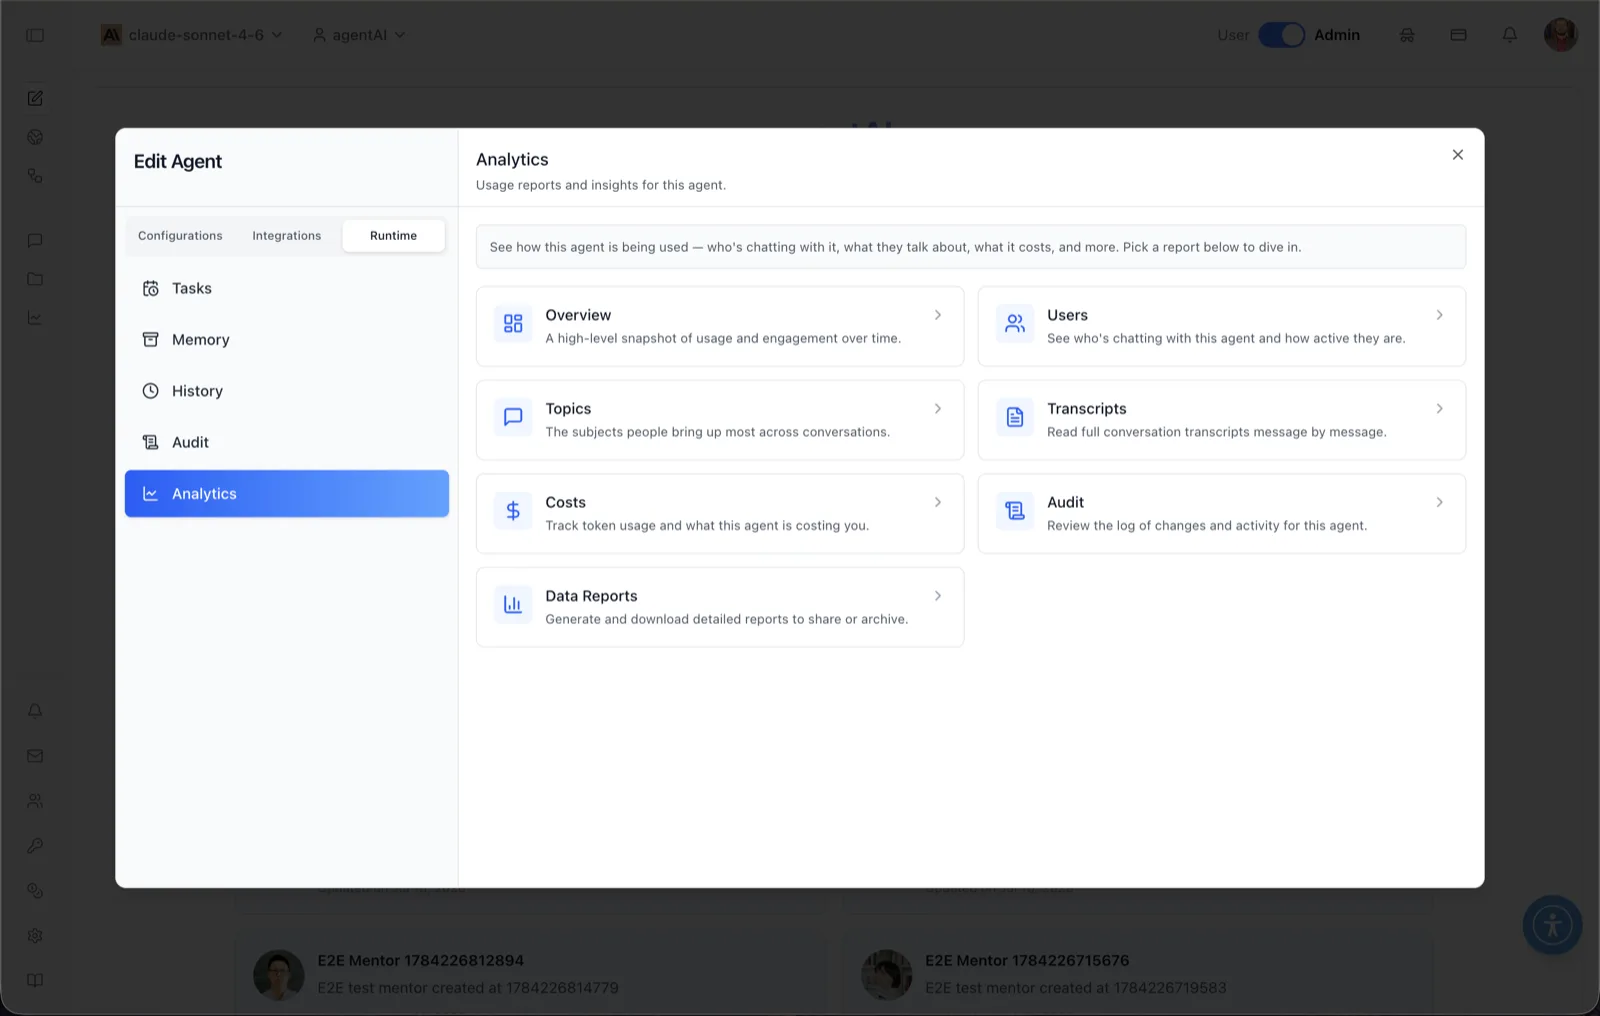
The Analytics panel is the launch point for every usage report available for an agent. The panel header reads: "Usage reports and insights for this agent," and the helper banner explains: "See how this agent is being used — who's chatting with it, what they talk about, what it costs, and more. Pick a report below to dive in."
Rather than rendering charts inline, this panel presents seven report cards. Clicking a card opens the corresponding full analytics report for the agent, so administrators can move from a quick launcher to detailed dashboards covering engagement, users, topics, transcripts, cost, audit activity, and downloadable data exports.
To reach this screen, open the Edit Agent modal, switch to the Runtime tab group (its sidebar lists Tasks, Memory, History, Audit, and Analytics), and select Analytics. Analytics is admin-gated: it is only available to users with permission to view the agent's analytics.
Target Audience
Administrator | Agent Builder
Report Cards
Overview
"A high-level snapshot of usage and engagement over time." Opens the Overview report, which summarizes agent activity — metrics such as messages, active users, topics, and conversations — with charts and time filters.
Users
"See who's chatting with this agent and how active they are." Opens the Users report with user-level metrics, including active users, access times, and per-user details.
Topics
"The subjects people bring up most across conversations." Opens the Topics report, which surfaces the most common conversation subjects along with conversation and message counts.
Transcripts
"Read full conversation transcripts message by message." Opens the Transcripts report, where each conversation can be read in full, message by message.
Costs
"Track token usage and what this agent is costing you." Opens the cost report, which breaks down spend — for example per day, by provider, by LLM, and per user.
Audit
"Review the log of changes and activity for this agent." Opens the same audit trail that is available from the Audit panel in this tab group — the record of who changed what and when on this agent.
Data Reports
"Generate and download detailed reports to share or archive." Opens the Data Reports surface, where report files (such as user reports) can be generated, reviewed, edited in a CSV editor, and downloaded.
How to Use
Step 1: Open the Analytics panel
In the Edit Agent modal, select the Runtime tab group, then click Analytics in the sidebar. The launcher grid of report cards appears.
Step 2: Pick a report
Click the card that matches your question — Overview for a general pulse, Users for who is active, Topics for what people ask about, Transcripts to read conversations, Costs for spend, Audit for change history, or Data Reports for downloadable exports.
Step 3: Work inside the report
Each report opens its own detailed view with filters and charts appropriate to that report. Use the report's own controls (such as time filters) to narrow the data.
Step 4: Export when needed
For shareable or archival output, use Data Reports to generate and download files rather than copying values out of the dashboards.