Analytics: Users
Overview
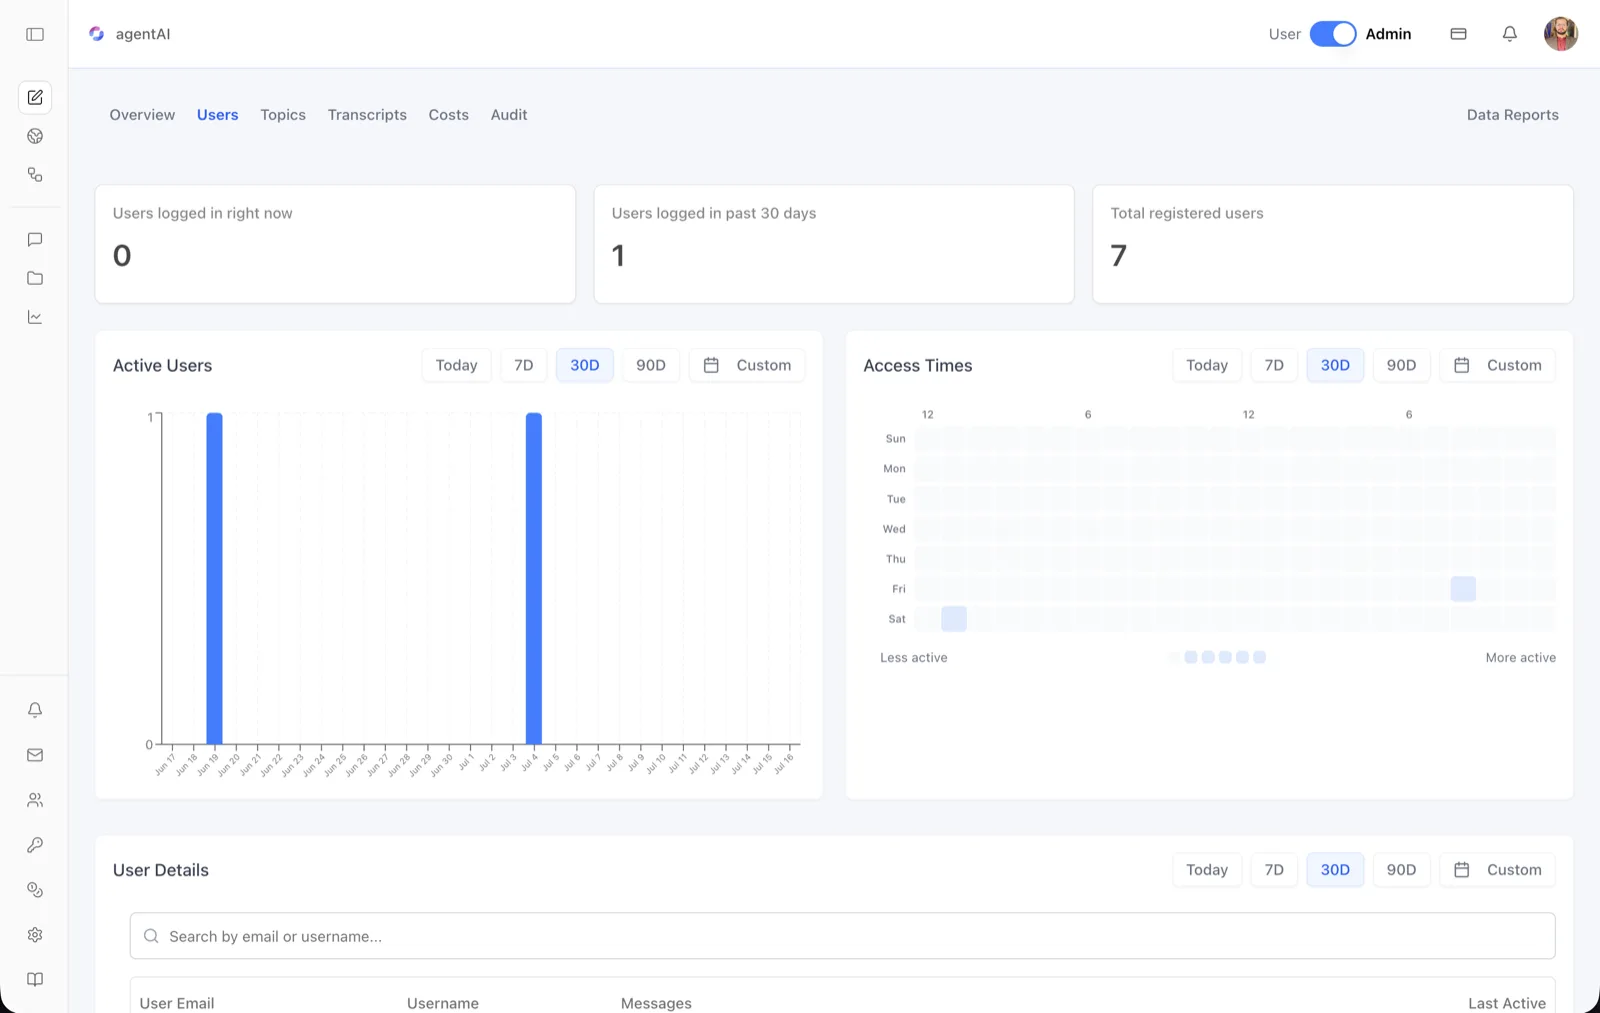
The Users tab breaks down who is using an agent and when. It combines live and historical login counts, a daily active-user chart, an access-time heatmap, and a searchable per-user activity table.
All figures are scoped to the agent selected in the header. The tab answers questions such as "how many people are online right now," "which days drive usage," and "what time of day are users most active."
To reach it, open the agent in OS, switch the header toggle to Admin, click the analytics icon in the left sidebar, then select Users in the tab bar (Overview · Users · Topics · Transcripts · Costs · Audit, with Data Reports on the right).
Target Audience
Administrator
What You See
Users logged in right now
A live count of users currently logged in and active with this agent.
Users logged in past 30 days
The number of distinct users who logged in during the last 30 days.
Total registered users
The total number of users registered on the platform for this agent's organization.
Active Users chart
A bar chart of distinct active users per day over the selected range. Each bar marks how many users interacted with the agent on that date, making usage spikes easy to spot.
Access Times heatmap
A day-by-hour heatmap of activity. Rows are the days of the week (Sun through Sat) and columns are the 24 hours of the day, labeled at six-hour marks (12, 6, 12, 6). Darker cells mean more activity; a legend beneath runs from Less active to More active, and hovering a cell shows its exact value.
User Details table
A per-user activity table with a search box ("Search by email or username...") and four columns: User Email, Username, Messages (the user's message count), and Last Active (when they last used the agent). Rows alternate shading for readability.
Date-range controls
The Active Users chart, Access Times heatmap, and User Details table each carry their own filter row — Today, 7D, 30D (default), 90D, and Custom (calendar picker) — so each panel can cover a different window.
How to Use
Step 1: Open the Users tab
From the agent workspace in Admin mode, click the analytics icon in the left sidebar, then click Users.
Step 2: Check the headline counts
Read the three cards for a snapshot: who is online right now, how many users came in the past 30 days, and the total registered population.
Step 3: Find your peak times
Scan the Access Times heatmap for the darkest cells — those day/hour combinations are when users engage most. Use this to schedule maintenance, content updates, or support coverage.
Step 4: Look up individual users
In User Details, type an email or username into the search box to filter the table. Sort through Messages and Last Active to identify your most engaged users and those who have gone quiet.
Step 5: Adjust the time windows
Use each panel's Today / 7D / 30D / 90D / Custom buttons to re-scope its data — for example, a 90-day heatmap for seasonal patterns next to a 7-day activity chart for the current week.