Analytics: Topics
Overview
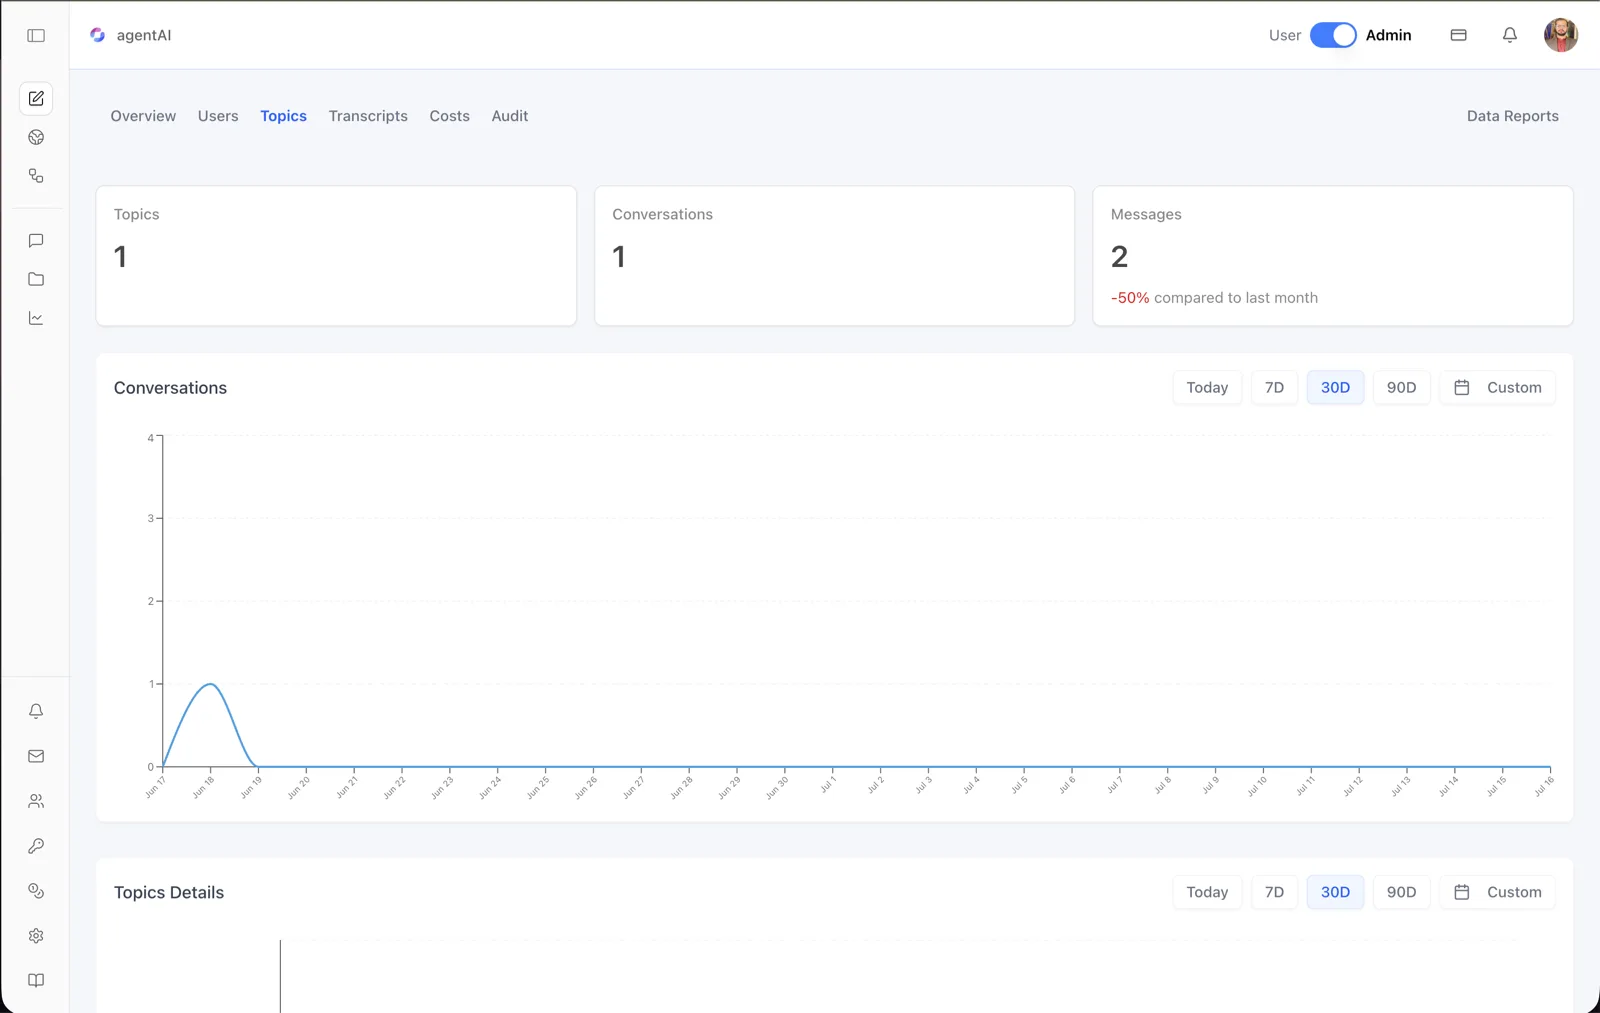
The Topics tab analyzes what users talk to an agent about. The platform automatically groups conversations into topics, and this dashboard shows how many topics exist, how conversation volume evolves over time, and how messages distribute across topics.
All figures are scoped to the agent selected in the header. Topic labels (such as "Study") are derived from conversation content, so the list grows as users raise new subjects.
To reach it, open the agent in OS, switch the header toggle to Admin, click the analytics icon in the left sidebar, then select Topics in the tab bar (Overview · Users · Topics · Transcripts · Costs · Audit, with Data Reports on the right).
Target Audience
Administrator
What You See
Topics card
The number of distinct conversation topics identified for this agent.
Conversations card
The total number of conversations held with the agent.
Messages card
The total number of messages exchanged. When prior-period data exists, the card shows a percentage change "compared to last month" — green for growth, red for decline (the screenshot shows "-50% compared to last month").
Conversations chart
A line chart of conversations per day across the selected range. Dates run along the x-axis; the y-axis is the conversation count, so you can see exactly when discussion activity peaked.
Average Rating chart
When users have rated the agent's responses, an Average Rating line chart also appears here, plotting the average rating over time on a 5-point scale (tooltips read "Average Rating: x.x / 5"). It is hidden when no rating data is available.
Topics Details chart
A horizontal bar chart listing each topic with the number of messages attributed to it. Topic names sit on the vertical axis and bar length is the message count, so the agent's dominant subjects are visible at a glance.
Date-range controls
Each chart card has its own filter row: Today, 7D, 30D (default), 90D, and Custom, which opens a calendar for arbitrary start and end dates.
How to Use
Step 1: Open the Topics tab
From the agent workspace in Admin mode, click the analytics icon in the left sidebar, then click Topics.
Step 2: Read the headline cards
Check how many topics have emerged, how many conversations have taken place, and whether message volume is up or down versus last month.
Step 3: Track conversation volume
Use the Conversations chart to see when users engage. Switch between 7D, 30D, and 90D to distinguish a short-term spike from a sustained trend.
Step 4: Identify dominant topics
Scroll to Topics Details and compare bar lengths. Long bars are the subjects your users care about most — useful for deciding what content to add to the agent's datasets or which prompts to refine.
Step 5: Cross-reference with Transcripts
When a topic stands out, open the Transcripts tab and filter by that topic name to read the underlying conversations.