Analytics: Costs
Overview
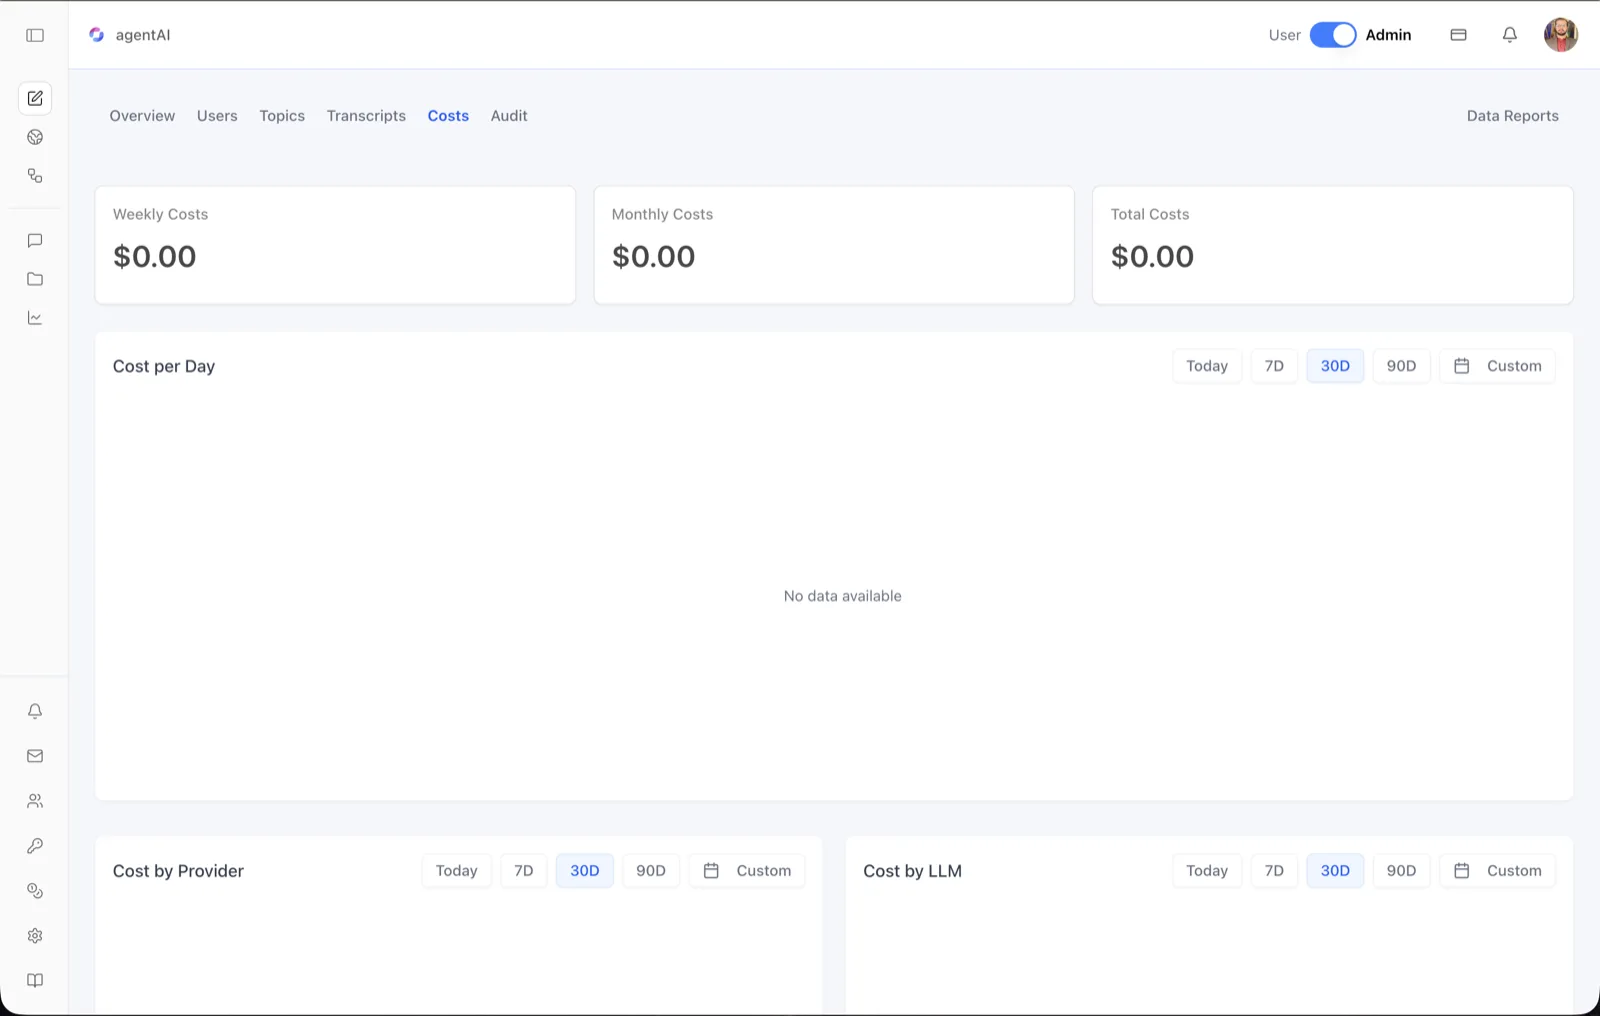
The Costs tab tracks the estimated LLM spend generated by an agent. It totals costs by week, month, and all time, then breaks spending down by day, by AI provider, by model, and by individual user.
Because OS is model-agnostic, an agent may route requests to different providers and models over time; this dashboard shows exactly where the money goes. All figures are scoped to the agent selected in the header and are shown in dollars.
To reach it, open the agent in OS, switch the header toggle to Admin, click the analytics icon in the left sidebar, then select Costs in the tab bar (Overview · Users · Topics · Transcripts · Costs · Audit, with Data Reports on the right).
Target Audience
Administrator
What You See
Weekly Costs card
The estimated cost incurred this week, in dollars, with a percentage change versus the prior period when available.
Monthly Costs card
The estimated cost incurred this month, in dollars.
Total Costs card
The all-time estimated cost for the agent, in dollars.
Cost per Day chart
A bar chart of estimated spend per day across the selected range. When nothing was spent in the window, the card shows a "No data available" empty state (as in the screenshot).
Cost by Provider chart
A pie chart splitting spend across AI providers, so you can see at a glance which vendor accounts for what share of the agent's cost.
Cost by LLM chart
A bar chart of total cost per model (for example, spend attributed to "gpt-4o-mini" versus other models), useful for judging whether an expensive model is earning its keep.
Cost per User table
Further down the page, a table attributes spend to individual users, with columns for User Email, Total Cost, Sessions, and Last Active — the place to spot unusually heavy consumers.
Date-range controls
Each chart card has its own filter row: Today, 7D, 30D (default), 90D, and Custom, which opens a calendar for arbitrary start and end dates.
How to Use
Step 1: Open the Costs tab
From the agent workspace in Admin mode, click the analytics icon in the left sidebar, then click Costs.
Step 2: Check the headline totals
Read Weekly, Monthly, and Total Costs for the current spend picture. A rising weekly figure against a flat monthly one signals a recent usage spike.
Step 3: Locate spend in time
Use Cost per Day to see which dates drove spending, adjusting the range with 7D, 30D, 90D, or Custom as needed.
Step 4: Attribute spend to providers and models
Compare the Cost by Provider pie and Cost by LLM bars. If one model dominates cost, consider whether a cheaper model in the agent's settings would serve as well — OS lets you switch models without rebuilding the agent.
Step 5: Review per-user consumption
Scroll to the Cost per User table to identify heavy users, correlate their Sessions and Total Cost, and follow up in the Transcripts tab to see what that usage looks like.